In Mebane Faber’s paper, “Quantitative Approach to Tactical
Asset Allocation,” he builds a quantitative market-timing model that employs a
trend-following strategy with built-in risk management. Specifically, he
utilizes a moving-average-based trading system which is the most commonly used
trend-following method. The system rules are simple and are as follows:
Buy Rule: Buy when monthly closing price > 10-month Simple
Moving Average (SMA)
Sell Rule: Sell and move to cash when monthly closing price
is < 10-month SMA
At most, this system will rebalance monthly if a market is range-bound.
However, when using the 10-month SMA (near equivalent to the 200-day SMA) as a
trading signal, systems generally have a propensity for less turnover than
other actively managed strategies.
The converse, and one basis for comparison, of an actively
managed strategy is a passively managed system. Faber’s research compares the
model against a buy-and-hold (i.e. long) allocation to the S&P 500. When comparing
S&P 500 total returns to the Timing Model total returns during 1901-2012, the
model generates favorable risk-adjusted returns. The larger annualized returns
were a product of less volatility and smaller drawdowns than the buy-and-hold
method. Faber notes, “One of the reasons for the overall outperformance is the
lower volatility of the timing system. It is an established fact that high
volatility diminishes compounded returns.” Moreover, when comparing the S&P
500’s ten worst years from 1900-2012 to the timing model, the model offers
exceptional outperformance. This further exemplifies how
trend-following/market-timing models provide a reliable system for positive
long-term performance against a buy-and-hold strategy. Specifically, the timing
model avoids large, negative left-tail events in its return distribution, but
continues to capture positive outlier (i.e. right tail) events as well.
Next, Faber begins discussing how to implement the “Global
Tactical Asset Allocation” (GTAA) or timing model across five global asset
classes: US stocks, foreign stocks, bonds, real estate, and commodities. Funds
are allocated equally across each asset class (i.e. 20% each) and either
invested in the market or in cash (i.e. T-Bills). Since 1973, 80% of the time
GTAA has invested at least 60% of the portfolio, thereby offering an
opportunity to capture risk premium. Additionally, GTAA enhanced risk
management through lowering the maximum drawdown from -46% to -10% and an
investor would have experienced only one year with an annualized return of less
than -1.0%. Faber continues to note that while the sample from 1973-2005
performed well, out of sample testing of GTAA from 2006 through 2012 was
necessary to evaluate the efficacy of the strategy in practice. “Even though
[GTAA] only outperformed in three out of seven years, it beat the buy-and-hold
strategy by over 2% per year, with much less volatility and most importantly to
many investors, lower drawdowns.”
While GTAA offers attractive risk adjusted returns further
customization can be applied to the strategy to meet particular investor needs.
For example, the model can accommodate more (or less) asset classes, employ
alternative cash management strategies, and/or structure a portfolio with different
asset class weightings. For example, Faber provides another test of GTAA using
thirteen Exchange Traded Funds (ETF’s) to represent different asset classes as
well as market capitalization and style categories within equities. The results
improved performance by nearly 150 basis points (bps) per annum as well as
enhanced risk measurements. While using five ETF’s to represent the
aforementioned asset classes produced favorable results when compared against
an S&P 500 buy-and-hold strategy, Faber’s second test with thirteen ETF’s
provided even better results implying that there is ample room for improvement
and bespoke asset allocations to accommodate each investor.
Current Review of Five Asset Classes:
As SPX currently sits below its 10 month SMA, the Cambria
model would implore investors to have a full cash allocation in their
portfolios. Despite January’s swift selling the model gave a sell-signal with
the close of December 2015 being just below the 10-month SMA. Looking at the
chart below, past consolidations under this moving average have been
short-lived since the bull trend began in 2009. However, toward the end of 2007
the initial closes below the 10 month SMA were an early warning sign from price
action for what became a period of financial crisis in 2008. Currently, SPX is
exhibiting some indecision on a monthly basis with respect to its 10-month SMA.
After the August 2015 sell-off the index generated a sell signal. In October,
SPX staged a reversal* and offered a buy signal. Now, SPX has begun another
move below its 10-month SMA. Time will tell when this trendless behavior will
end and price begins to move in a sustained manner, but until that time
investors should understand that using Faber’s GTAA model will continue to
produce favorable performance statistics given its robustness in testing and
application.

In June 2015 the FTSE All-World Ex-US Index, represented by
VEU, began to show signs of weakness with a close below its 10-month SMA.
Selling accelerated in August of 2015 along with the US markets and the price
has stayed below its 10-month SMA ever since. Looking at the ten-year monthly
chart of VEU it can also be noted how lackluster the post-financial crisis
recovery was for the rest of the world as the 2007 highs were never cleared. In
fact, since the 2014 highs VEU has been forming a downtrend channel confirmed
by GTAA.

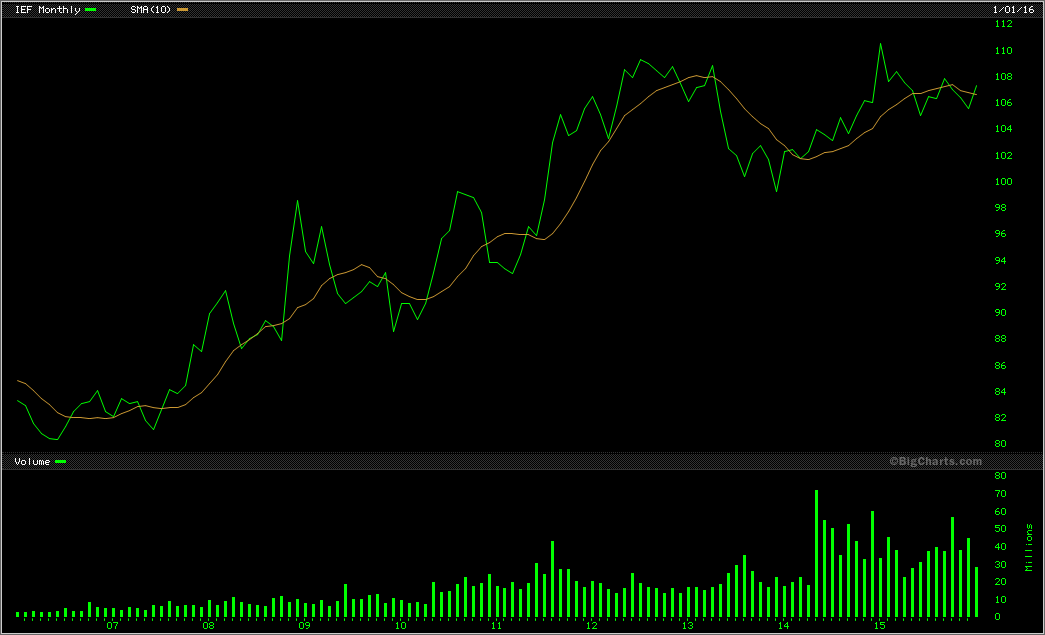
Presently, the 7-10 Year Treasury Bond market, IEF, is
providing a buy signal with January’s price action. Of course, this cannot be
confirmed until month-end. However, it would be a reversal of trend since a
sell signal was issued in October 2015. In the 10 year monthly chart there is a
clearly defined uptrend in place since the double-bottom in 2006-2007 and GTAA
has offered reliable entries and exits along the way.
Real Estate, as portrayed by VNQ, last issued a buy signal
in October 2015 but at this point in January is ready to close the previous position
with a fresh sell signal. Again, as with IEF, VNQ has been in a sustained
uptrend for several years with only a few entries and exits incurred by a GTAA
investor.

Commodities (DBC) have been in a prolonged downtrend since
the monthly close below the 10-month SMA in late summer 2014. The persistence
of the move has been impressive by many measures, but from this model’s
perspective the price has yet to close above the 10-month SMA. While the
decline in Crude Oil prices receives a majority of trader’s attention and is a
large component of DBC, the downtrend in commodities has been indifferent to
energy, agricultural, and metals commodities. This chart is arguably the best
example of how implementing GTAA adds value to an investor’s portfolio.

* See post entitled “MACD Confirmation and Divergence in
2015” for a look at the technical underpinnings developing in the market at
that time.
Note: All charts are
arithmetic in scale. Charts are line charts constructed using monthly closing
values.
JD
Comments
Post a Comment